
KEY POINTS
-
- Gasoline prices have risen sharply since late February 2026, increasing costs for New Hampshire households.
- Households with lower incomes may face greater hardships from these increases as fuel costs are now require a larger share of personal budgets.
- Rural households may be especially affected, as residents often need to drive longer distances for work, services, and everyday needs.
- State transportation revenue could be lowered if higher gasoline prices prompt people to drive less or make other choices that reduce fuel consumption.
- New Hampshire’s roads and bridges have improved over the last decade, and continued progress will depend in part on sustained public investment.
Since late February, gasoline prices in New Hampshire and throughout most of the world have risen sharply. For many Granite Staters, particularly those in rural areas with few transportation alternatives and who have low and moderate incomes, these higher fuel costs have created immediate financial pressure. Nearly 600,000 New Hampshire workers commuted by motor vehicle in 2024, meaning that even modest increases in gas prices can significantly impact household budgets, many of which are already strained by the high cost of other essentials including housing, health care, and child care.[1]
In addition to short-term financial pressures on households, rising gasoline prices may also have longer-term implications for the State’s roads and bridges. As fuel costs rise, some residents may choose to drive less, drive more efficiently, combine trips, use vehicles that consume less gasoline, or reduce fuel consumption in other ways to save money. New Hampshire’s Motor Fuels Tax, a key funding source for New Hampshire’s road and bridge maintenance, is based on the number of gallons purchased rather than the retail price of gasoline. As a result, higher prices do not automatically generate additional transportation revenue for the State. However, if residents buy less fuel overall, revenue available for road and bridge maintenance and improvements could decline. At the same time, higher gasoline prices may have an impact on the cost of maintaining and improving transportation infrastructure. Higher fuel prices can increase the cost of construction materials, transportation, and labor across the economy, potentially putting additional pressure on infrastructure budgets even as revenues may become more constrained.
These funding pressures come as New Hampshire has made meaningful progress improving its transportation infrastructure. Over the last decade, more State-maintained roads and bridges have been rated in good or fair condition, while the number of red-listed bridges has declined significantly. Maintaining this progress will require continued State investments, especially as construction costs continue to rise and the State officials project possible challenges funding New Hampshire’s Ten-Year Transportation Improvement Plan.
Gasoline Prices Rising Quickly Over a Short Period
Since the start of the conflict in Iran on February 28, 2026, global petroleum energy prices have risen sharply.[2] Gasoline prices have not increased this quickly since 2022, following Russia’s invasion of Ukraine.[3]
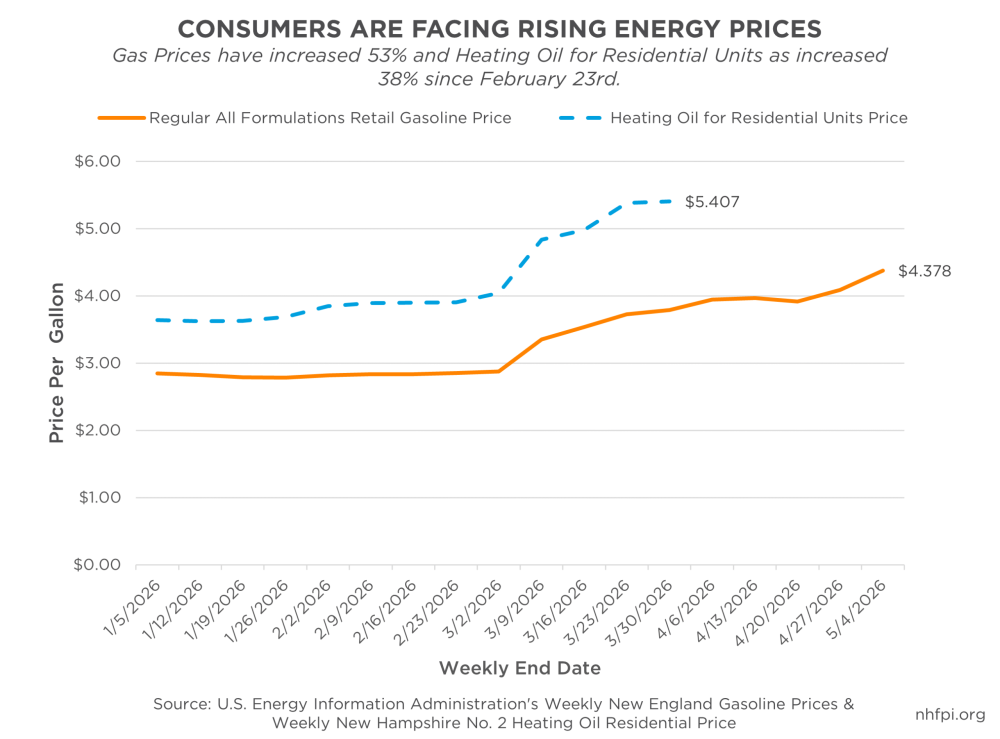
As of May 14, 2026, New Hampshire’s average daily price for gasoline was $4.49 per gallon, according to the American Automobile Association (AAA), a private-sector group that uses credit card transaction data to track prices.[4] Weekly public data from the U.S. Energy Information Administration also shows gasoline prices across New England increased between February 23 and May 11, 2026 by $1.63 (57%) per gallon. For the week of May 11, the average price of regular gasoline in New England reached $4.48 per gallon.[5]
The average price of residential heating oil prices is also increasing. The price of a gallon of No. 2 residential heating oil increased from $3.91 per gallon on week of February 23 to $5.41 per gallon by the week of March 30, a 38% increase.
New Hampshire Gasoline Prices Compared with the Region
New Hampshire’s average daily gas price was slightly below AAA’s New England Average, under the regional figure by about 2.9 cents per gallon as of May 7, 2026. Connecticut, Maine, and Vermont reported higher average gasoline prices than New Hampshire, while Rhode Island and Massachusetts reported lower averages. Both New Hampshire and the New England region remained below the national average price of $4.56 per gallon as of May 7.
Gasoline prices also vary across New Hampshire. County-level data from AAA show minor differences. On average, drivers in Grafton, Cheshire, Hillsborough, Merrimack, and Rockingham counties may pay somewhat lower prices than drivers in other parts of the state. Prices at individual gas stations can vary considerably even within short distances.
Lower-Income and Rural Households May Face Greater Financial Pressure Due to High Gas Prices
Rising gasoline prices can place additional pressure on household budgets, particularly when families were already facing relatively high costs for other basic needs. New Hampshire’s rising cost of living has strained household budgets, as the a four-person household earning the state’s median household income fell $2,000 short of covering the cost of owning a house, child care, gasoline, health care, and food in 2024.[6] The extent of that pressure can depend on how many miles members of a household drive, the fuel economy of its vehicle(s), and how many drivers live in the household.
This observed increase of about $1.53 per gallon between February 28 and May 7 could add substantial annual costs for many drivers. A household with a less fuel-efficient vehicle, such as one that is larger or older, that averages 22 miles per gallon could pay about $768 more per year, assuming 11,071 miles driven annually, which was the average amount driven by a light duty vehicle in the United States during 2024.[7] A household with a more fuel-efficient vehicle, such as one that is smaller or newer and built for fuel conservation, averaging 38 miles per gallon could pay about $445 more per year under the same driving distance assumption. Households with two drivers could see those costs potentially double. Costs could be even higher for households that drive more miles than the national average, which could include many rural households.
Higher fuel costs may also affect households differently depending on income. Households with higher incomes are generally better able to absorb rising fuel costs without changing driving habits. Households with lower incomes may be more likely to reduce driving or shift spending away from other household needs. An analysis by the Federal Reserve Bank of New York of recent gasoline price increases found that households with lower incomes reduced the number of gallons of gasoline purchased more than those with higher incomes, although the amount of money these households spent on gasoline increased because of the higher price per gallon.[8]
Gasoline Prices and New Hampshire’s Highway Fund
Gasoline prices also affect New Hampshire’s transportation funding system.
New Hampshire has a Motor Fuels Tax, which is formally called the Road Toll in State law but is a separate and distinct revenue source from the tolling operations on State Turnpikes. The Motor Fuels Tax is not tied directly to the price of gasoline, but instead the State charges a flat tax on each gallon of gasoline sold. The State currently charges a base rate of $0.222 per gallon, along with two separate surcharges related to oil discharge cleanup of $0.0155 in 2026, for a total Motor Fuels Tax of about $0.2375 per gallon.[9] This tax is one of the primary revenue sources that supports the State’s Highway Fund.[10] In 2025, New Hampshire collected more than $188.2 million in Motor Fuels Tax revenue.[11]
Because this tax is charged per gallon, if gasoline prices rise but drivers continue purchasing the same number of gallons, Motor Fuels Tax revenue remains unchanged. If higher prices lead people to buy less gasoline, drive less often, or move toward more fuel-efficient vehicles, Motor Fuels Tax revenue could decline. Changes in driving behavior could affect future Motor Fuels Tax revenue and the amount of support available for transportation investments across the State.
The Current State of New Hampshire Roads and Bridges
In 2025, there were 16,732 miles of public roads in the state, with 4,597 miles (27.5%) managed by the New Hampshire Department of Transportation (NHDOT).[12] There were 3,780 bridges in the state as well, with 2,138 (57%) managed by NHDOT, as of April 2026.[13]
Road Conditions
Road pavement conditions are commonly measured using the International Roughness Index (IRI).[14] IRI measures pavement roughness in inches per mile, with lower values indicating smoother roads. NHDOT classifies pavement conditions as Good, Fair, Poor, Very Poor, or Not Rated. Good pavement has an IRI below 95. Fair pavement has an IRI from 95 to 170. Poor pavement has an IRI above 170 and up to 350. Very Poor pavement has an IRI above 350.[15]
NHDOT’s annual report shows the impact of continued investment in the State’s infrastructure: the share of State-maintained roads in Good or Fair condition increased from 68% in 2014 to 85% in 2024.[16] As of 2024, the NHDOT reports that 2,543 miles (55.5%) of the State system’s pavement conditions are classified as “Good” and 30.6% or 1,403 miles as “Fair,” while 587 miles of pavement is classified as “Poor” and 47 miles are classified as “Very Poor.”
Bridge Conditions
The State’s “Red List” tracks structurally deficient bridges. Red-listed bridges are those that have at least one poor rating of a major structural element.[17] These bridges remain safe to drive over, yet they may have weight restrictions, and they require more frequent inspections under State law.
As of 2025, New Hampshire had 114 state-owned and 212 municipally-owned bridges on the Red List, meaning that about 8.6% of the bridges in the state were red-listed. The number of State-owned, red-listed bridges has dropped by about 24% since 2016,[18] while the number of municipal red-listed bridges has dropped by 62% during the last decade.[19]
The consistent reduction in red-listed bridges and the decrease in the mileage of poor-condition pavement reflect the impact of fiscal investments over the last decade. The State, with assistance from the federal government, has continued to invest in transportation and reduce the number of poor-condition bridges and roads across all roadway classifications, including local roads.[20]
All Gets Funded: From Interstates to Local Roads
For a driver to move from a major highway to a local road and not experience a sudden change in road quality, a mix of funding from federal, State, and local sources is required.
Funding for transportation operations comprises 10% of the State Budget.[21] The primary source of funding for State Road and bridge projects and maintenance is the State’s Highway Fund, which is supported by several revenue streams.[22] The three largest sources of revenue are the Motor Fuels Tax, motor vehicle registration fees, and federal funding.[23]
Federal Highway Administration (FHWA) funds are a major contributor to the state’s transportation network, although those funds are often limited to capital construction and rehabilitation projects on eligible routes and may also pass through the State to counties and municipalities.[24] State funding provides additional support for those local projects, while also funding maintenance and upkeep of the broader system. These State expenditures include funding from the Turnpike Fund, the State Betterment program (which supports paving, bridge rehabilitation, and preservation efforts that are not covered by federal funds), and, in some cases, one-time General Fund appropriations approved by lawmakers.[25]
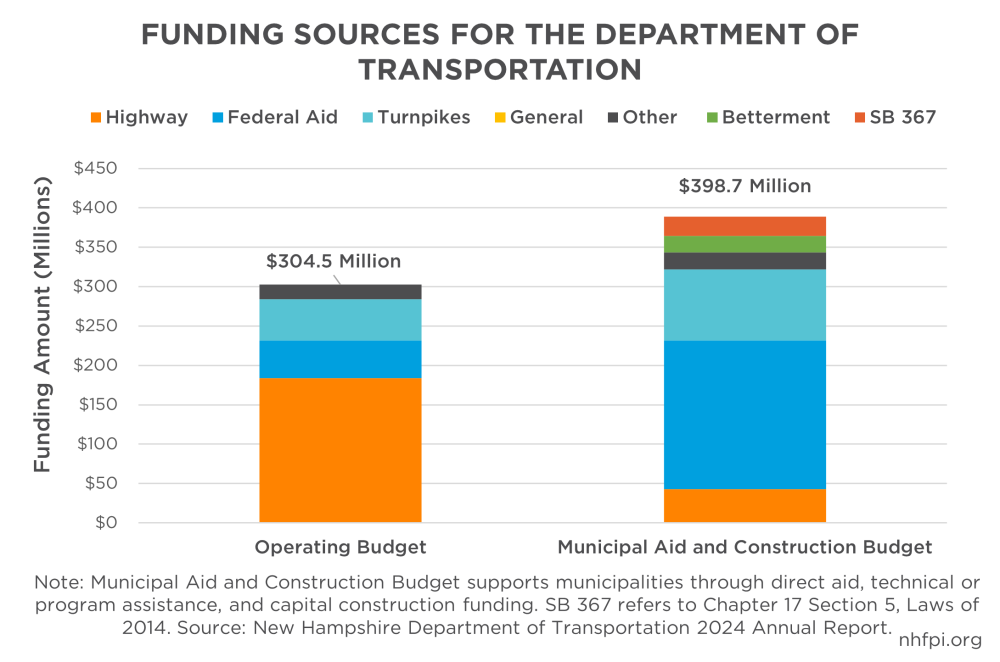
For State Fiscal Year 2024, NHDOT’s reported expenses were $763.4 million. About 60% of its expenses went specifically towards capital construction projects and to municipalities, whether directly or indirectly through technical or program assistance. The remaining expenditures are in the NHDOT’s operating budget.[26] Funding from the federal government makes up 47% of the combined NHDOT expenditures on municipal aid and construction programs.[27]
Looking ahead, an expected increase in the number of necessary infrastructure projects along with inflation may put strain on existing funding mechanisms. The NHDOT estimates the current Ten-Year Transportation Improvement Plan will cost approximately $400 million more than what revenue sources are projected to provide.[28]
At the municipal level, local governments receive State block grant aid to help maintain local bridges and roads, and limited direct federal assistance. However, the majority of local government services, of which infrastructure construction and maintenance are key components, are funded through local property taxes.[29]
Conclusion
Rising gasoline prices are creating immediate and short-term financial challenges for many Granite State households, particularly those with lower incomes, less fuel-efficient vehicles, longer commutes, or fewer transportation alternatives. For many families, higher fuel costs can place additional strain on already tight household budgets, especially in rural parts of the State where driving is often a necessity rather than a choice.
At the same time, in the long-term high fuel prices could also strain the State’s ability to fund needed improvements for the state’s bridges and roads. New Hampshire’s road and bridge conditions have improved over the last decade with the number of State-maintained roads rated in “Good” or “Fair” condition increasing from 68% in 2014 to 85% in 2024 and the number of State-owned red-listed bridges dropping by about 24% over the last decade. However, maintaining these improvements will require continued State investment. If high fuel prices lead to less driving overall, the amount of revenue raised by the Motor Fuel Tax, a key funding source for road and bridge improvements, may be affected.
The combination of higher gasoline prices and fewer dollars available for transportation infrastructure improvements could have significant impacts on Granite Staters, particularly residents of rural areas and those with lower incomes.
Endnotes
[1] See U.S. Census Bureau, American Community Survey One-Year Data for 2024, Means of Transportation to Work by Selected Characteristics, S0802
[2] The conflict in Iran refers in part to the United States government’s Operation Epic Fury, which the U.S. military engaged in beginning February 28, 2026.
[3] See U.S. Energy Information Administration (EIA)’s Weekly New England (PADD 1A) All Grades All Formulations Retail Gasoline Prices.
[4] See AAA’s State Gas Price Tracker.
[5] See EIA’s Weekly New England (PADD 1A) Regular All Formulations Retail Gasoline Prices.
[6] See NHPFI’s October 2025 report Affordability Eroded: Changes to the Cost of Living in New Hampshire.
[7] For more data about vehicle miles traveled, see the U.S. Department of Transportation’s Office of Highway Policy Information, Highway Statistics 2024.
[8] The May 6, 2026 Federal Reserve Bank of New York post analyzes the impact that the surge in gasoline prices has had on households in the United States. The authors of the post found that there is a K-shaped consumption pattern across income groups. They also found that this episode mirrors the 2022 energy shock following the Russian invasion of Ukraine. See the Liberty Street Economics post Same Shock, Different Roads? A K?Shaped Pattern at the Pump.
[9] See RSA 260:32 and RSA 260:32-a. New Hampshire also has a $0.01331 and a $0.00215 tax on gasoline help fund Oil Discharge and Disposal Cleanup Fund, see RSA 146-a and RSA146-d. To see all motor fuel taxes by state see Motor Fuel Tax Information by State.
[10] For the accounting of Highway Fund revenue sources in State Fiscal Year 2025, see the New Hampshire Annual Comprehensive Financial Report for the Year Ending June 30, 2025, page 121.
[11] See FY 2025 Annual Comprehensive Financial Report, page 121 for Highway Fund revenue.
[12] See New Hampshire Department of Transportation 2025 Roads and Highways Facts & Figures.
[13] Annual Bridge Condition Data shared by New Hampshire Department of Transportation.
[14] See New Hampshire Department of Transportation FY 2024 Annual Report.
[15] See New Hampshire Department of Transportation’s 2024 Pavement Conditions.
[16] The Federal Highway Administration defines the International Roughness Index (IRI) as a standard measure of pavement roughness, reported in inches per mile, that reflects how deviations in the pavement surface affect vehicle movement and ride quality.
[17] SB 38 (2017) changed red-list bridge criteria so now a bridge is now only placed on the Red List if it is structurally deficient, meaning at least one of its major structural elements has an NBIS condition rating of 4 or less. See RSA 234:25-a on new classification of Red-Listed Bridges.
[18] See New Hampshire Department of Transportation report 2023 State-Owned Red List Bridges. A 2016 performance audit of NHDOT Bridge Maintenance found that the number of bridges rated Red was growing.
[19] See New Hampshire Department of Transportation report Municipally-Owned 2025 Red List Bridges. Seventy-one bridges were removed from the municipal red list in 2017 due to changes made to RSA 234:25-a.
[20] See NHFPI Policy Points 2025: Transportation.
[21] See NHFPI report on The State Budget for Fiscal Years 2026 and 2027.
[22] See New Hampshire’s 2025 Annual Comprehensive Financial Report.
[23] See NHFPI’s 2017 Revenue in Review. The Motor Fuel Tax is also referred to as a road toll, which is separate from the turnpike tolling. See New Hampshire’s Division of Administration’s explanation of Road Tolls.
[24] The Federal Highway Administration’s Surface Transportation Block Grant; § 11109; 23 U.S.C. 133 provides flexible funding for State and local transportation funding. Learn more about the Surface Transportation Block Grant in NHFPI’s May, 2025 Issue Brief Federal Funding and Employment in New Hampshire.
[25] See New Hampshire Department of Transportation FY 2024 Annual Report, pages 2 thru 5. See NHFPI’s issue brief on the House of Representatives Budget Proposal for State Fiscal Years 2024 and 2025 about General Fund transfers into the Highway Fund.
[26] See New Hampshire Department of Transportation FY 2024 Annual Report, pages 1 and F13.
[27] See the New Hampshire Department of Transportation FY 2024 Annual Report, page 48.
[28] See New Hampshire’s Department of Transportation’s 2027-2036 Draft Ten Year Plan (slide 9) presentation to the New Hampshire House of Representatives Public Works and Highways Committee.
[29] See NHFPI’s April 2026 report Property Taxes in New Hampshire: How They Work and How They Compare.