Your boss probably keeps close track of your attendance at work, along with other metrics about your job performance. Still, many of us don’t stop to consider how often our elected officials attend votes at the State House. With the New Hampshire Legislature on summer break, it’s time to ask “how often did my elected representatives show up to work?”
The Senate vs. the House
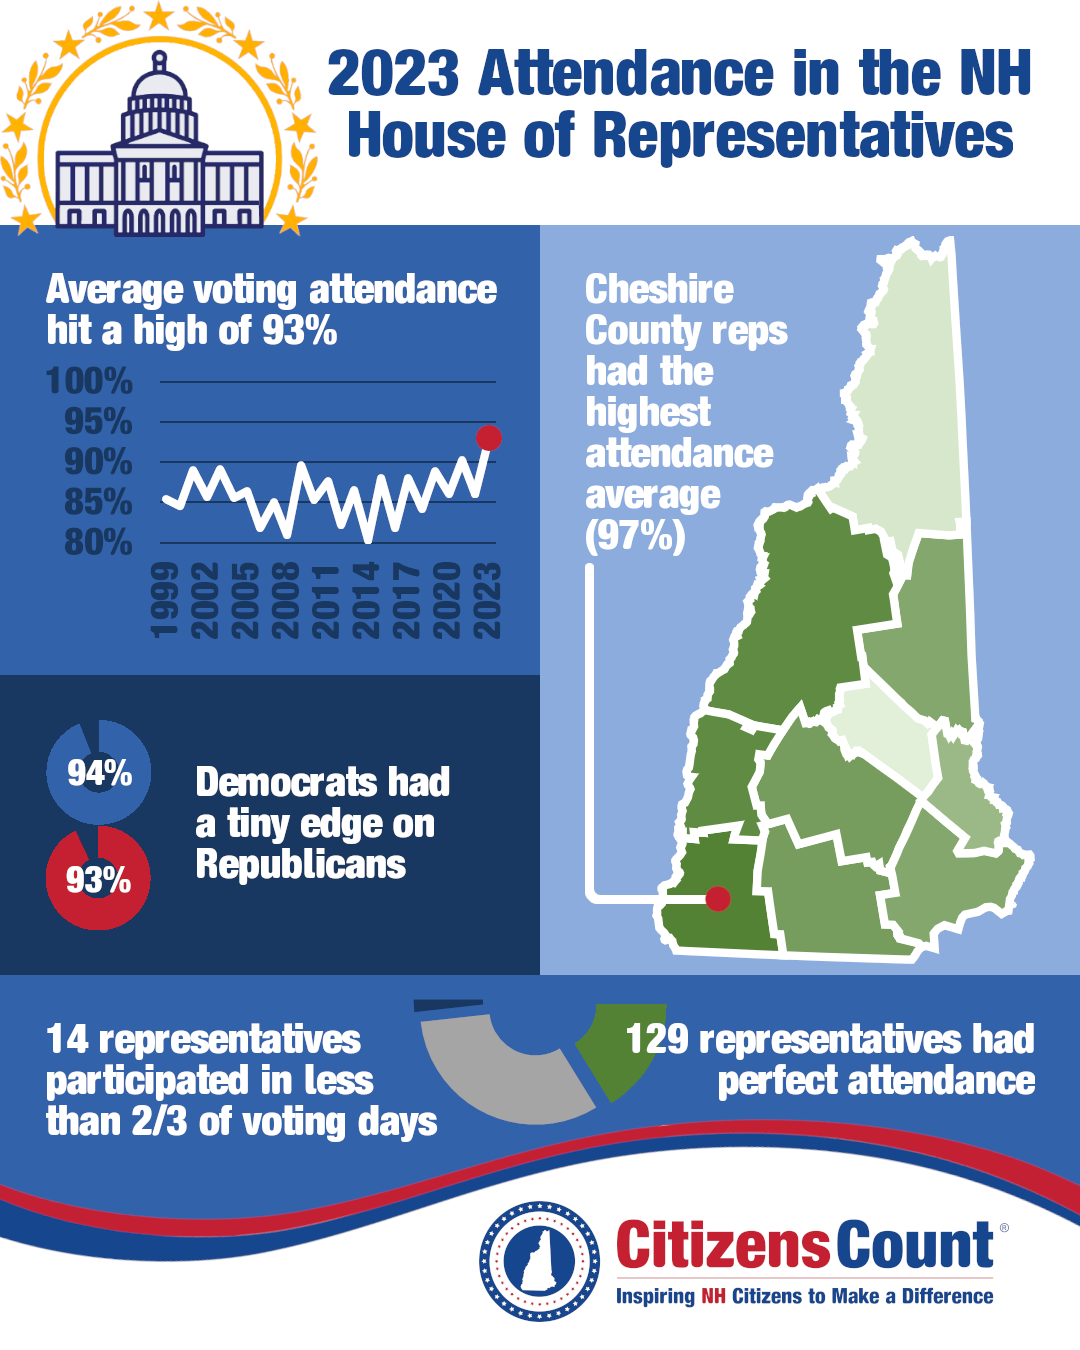
The New Hampshire Senate has consistently high attendance, and this year was no different—on average, our state senators each participated in 99% of votes. Over the years, the New Hampshire House hasn’t had such a consistently high attendance record; reviewing attendance data back to 1999 shows that the percent average for all representatives is usually in the mid-80s. (The worst year for attendance in that timeframe was 2014, when state representatives attended just 80% of votes on average, meaning your typical representative missed one out of every five votes!) Happily, the same data show representatives reached their highest level of attendance yet in 2023, at 93%.
House Democrats vs. Republicans
Next, let’s look at attendance data by party. For this, we’ll turn to the record of roll call votes in the House. In a roll call vote, there is a record of how each individual representative voted. Roll call votes differ from voice votes, where representatives simply shout their votes and the loudest side wins (this kind of voting is usually reserved for less controversial bills).
Democratic representatives had a slightly higher attendance average than Republicans; Democrats averaged 94% participation in roll call votes, while Republicans averaged 93%. That was an important edge on certain voting days, such as when the House voted down HB 10 and SB 272 (both Parental Bill of Rights bills). For HB 10, there were seven Republicans representatives absent, compared to just six Democrats. For SB 272, there were once again seven Republican representatives absent, compared to just three Democrats. A small handful of Republicans also broke rank to kill these bills, but their votes could have been overpowered if other Republicans attended those voting days.
There were also five roll call votes in the House that were a perfect tie, and four more were decided by just one vote.
All told, 129 representatives get the gold star for absolutely perfect attendance, participating in every single roll call this year. Another 133 showed up to every single voting day but missed some roll call votes (if they had to leave early, for example).
On the other end of the spectrum, fourteen representatives attended less than two-thirds of the voting days they were sworn in for this year: seven Democrats and seven Republicans. (Stace-Marie Laughton and David Cote of Nashua were not sworn-in, so they are not included on this list of fourteen.) We will not call out any of these individual legislators here, but we encourage voters to find their legislators at citizenscount.org/elected-officials and check out their attendance. If any legislator wants to add a note to their attendance records on our website, Citizens Count is happy to include a statement about missed days.
Attendance by county
Wondering how representatives from your area stack up in terms of attendance in 2023? Here is a breakdown of New Hampshire House attendance data by county:
-
Belknap: Attended 91% voting days, participated in 85% of votes on average
-
Carroll: Attended 94% of voting days, participated in 93% of votes on average
-
Cheshire: Attended 98% of voting days, participated in 97% of votes on average (Winner!)
-
Coos: Attended 90% of voting days, participated in 86% of votes on average
-
Grafton: Attended 96% of voting days, participated in 96% of votes on average
-
Hillsborough: Attended 95% of voting days, participated in 94% of votes on average
-
Merrimack: Attended 96% of voting days, participated in 94% of votes on average
-
Rockingham: Attended 95% of voting days, participated in 93% of votes on average
-
Strafford: Attended 92% of voting days, participated in 91% of votes on average
-
Sullivan: Attended 98% of voting days, participated in 96% of votes on average
Find out more
Want to learn more about how your elected officials have performed? We track attendance, positions on key issues, votes, and much more. Visit citizenscount.org/elected-officials to get started.
These articles are being shared by partners in The Granite State News Collaborative. For more information visit collaborativenh.org.

