
New Hampshire’s housing market has continued to create significant challenges for both homeowners and renters. Prices remain elevated, rising further upward even after the larger increases recorded during the COVID-19 pandemic. While the pace of price growth has slowed statewide, the overall cost of purchasing a house remains historically high, with median sale prices consistently exceeding half a million dollars over the past two years. As core living costs, particularly housing, continue to outpace income growth, affordability challenges remain, limiting homeownership opportunities for many Granite State families.
Persistent high housing costs are closely tied to limited housing supply, which has not kept pace with demand. While there have been slight increases in inventory since the pandemic, supply in both the homeownership and rental markets remains well below levels needed to be considered a balanced market. Both homebuyers and renters across New Hampshire continue to face constrained options and rising costs, reinforcing ongoing challenges around housing availability and affordability across the state.
High Prices Persist for New Homeowners
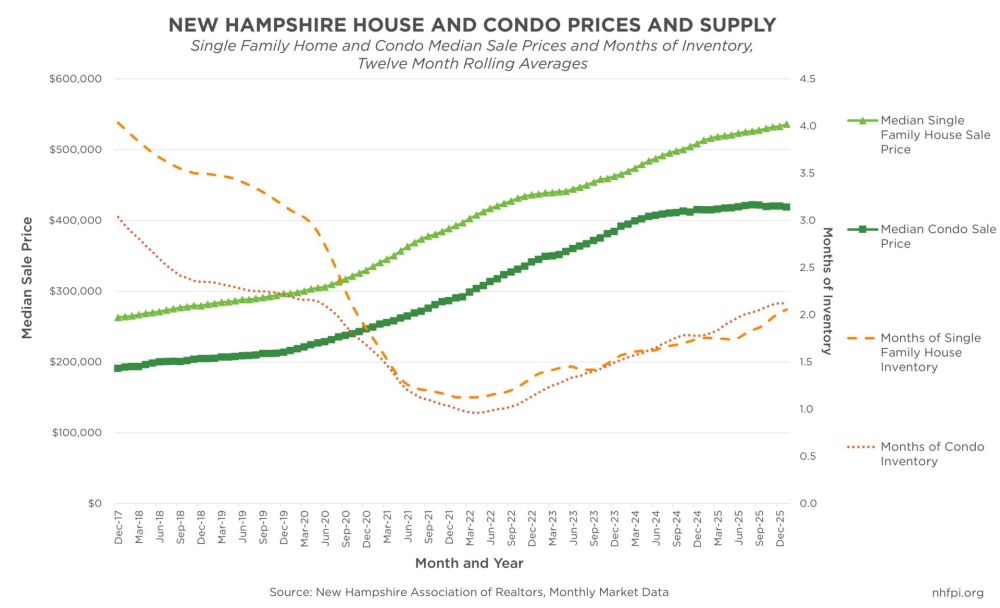
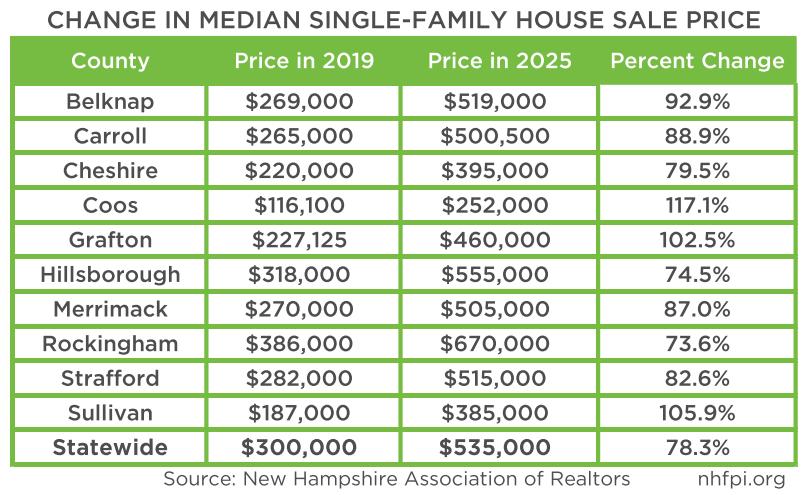
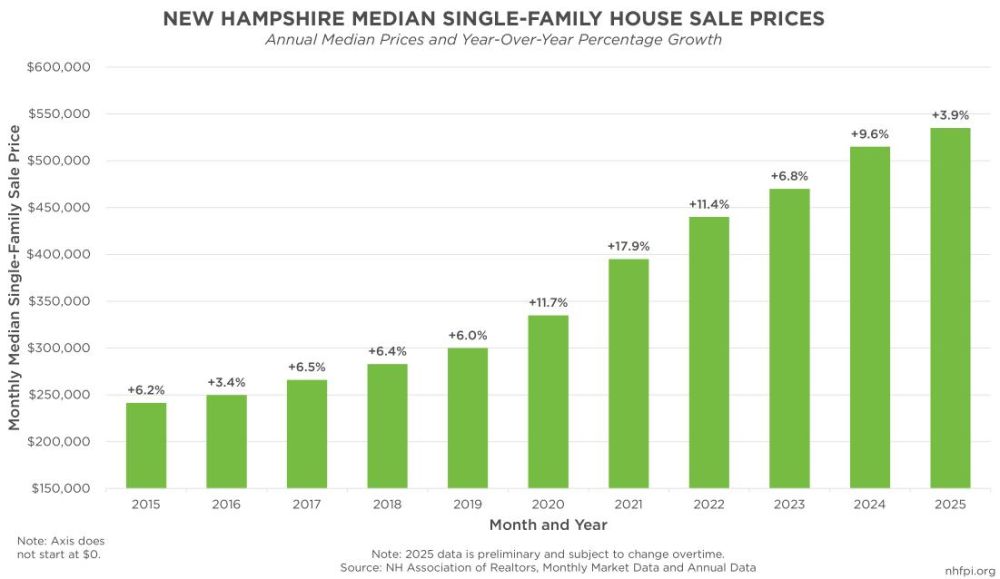
New Hampshire’s single-family housing market has experienced substantial growth over the past several years, with median prices reaching record highs since the onset of the COVID-19 pandemic. In 2025, the median cost for purchasing a single-family house rose to $535,000, an increase of 78.3% from 2019 and 290.8% from 1999, not adjusted for inflation.[1] Since March 2024, the statewide median price has consistently remained at or above half a million dollars, standing at $525,000 as of February 2026, according to the most recent data.[2] House prices typically depend on the season, often with declines in the winter followed by increases in the spring and summer months, suggesting February’s decline relative to the 2025 median does not indicate lower overall prices.[3]
New Hampshire’s rising housing prices have surpassed those in neighboring New England states. In 2025, the median price for a single-family house in Vermont was $435,000, while Maine’s median was $405,000, both of which remained below New Hampshire’s number. Although house prices in New Hampshire remain lower than in Massachusetts, they have increased more rapidly in recent years. Between 2019 and 2025, the median price for a single-family house in Massachusetts rose by 60.9%, compared to a 78.3% increase in New Hampshire. During the same period, price growth in Vermont (76.8%) and Maine (80.0%) was similar to New Hampshire’s increase.[4] Housing prices have generally remained elevated in the northeastern region of the country. From 2023 to 2025, national data recorded a 6.4% increase in the median price for a single-family house ($394,100 to $419,300) nationwide, while prices jumped by 17.3% in the northeast ($444,400 to $521,400) during that same time period.[5]
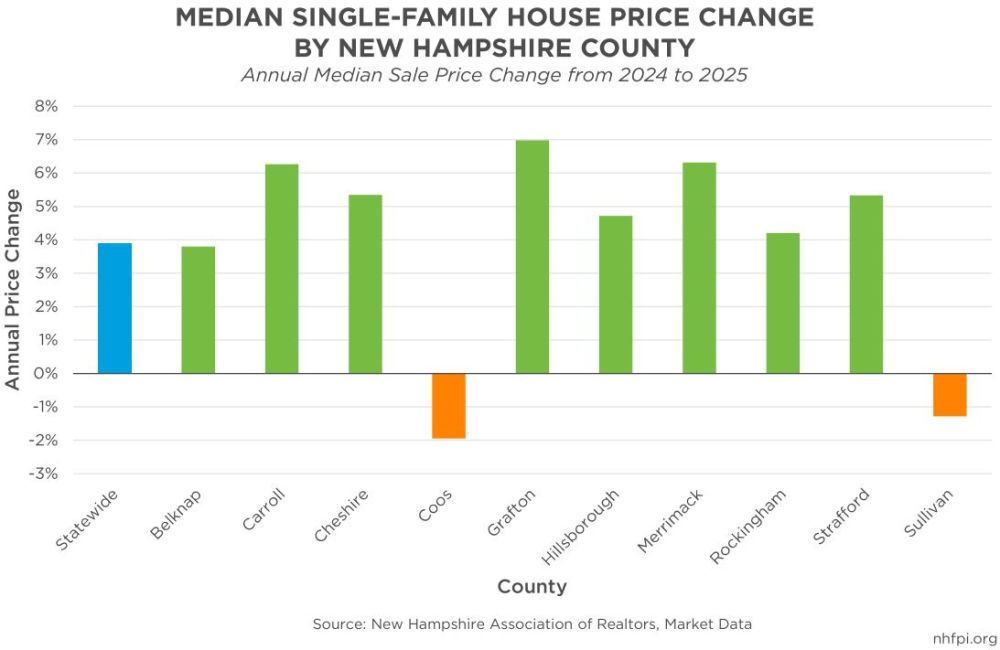
While prices have continued to climb in New Hampshire, recent trends suggest that the pace of growth may be slowing in some parts of the state. From 2024 to 2025, the statewide median price increased by 3.9%, the smallest annual gain since 2016. During the height of the COVID-19 pandemic and associated housing market pressures, the median sale price surged by 17.9% between 2020 and 2021, which was the largest annual increase in recent history.[6]
While growth has slowed statewide, county-level data indicate that price growth remains elevated in several regions of New Hampshire. Between 2024 and 2025, half of the state’s ten counties recorded median price increases exceeding 5%, ranging from 5.3% in Cheshire and Strafford Counties to a high of 7.0% in Grafton County. In Hillsborough and Rockingham Counties, the state’s two most populous counties, median prices rose by 4.7% and 4.2%, respectively, only somewhat elevated relative to the statewide average. Coos and Sullivan Counties were the only counties to experience annual declines in median prices, at 1.9% and 1.3%, respectively.[7]
Since the start of the pandemic, New Hampshire’s rural counties have seen the fastest median sale price growth, likely reflecting increased demand driven by remote work opportunities and early retirees migrating to the state. Although the four southeastern counties continue to have the highest home prices, in-migration has likely placed additional pressure on housing markets in more rural areas with limited supply. In-migration is key for the state’s economy, as it has been New Hampshire’s only source of population growth since 2017.[8]
The recent price declines in Coos and Sullivan Counties follow several years of rapid growth. From 2019 to 2025, median sale prices increased by 117.1% in Coos County and 105.9% in Sullivan County, the largest gains in the state.[9] The recent slowing in these county-level markets may reflect several factors, including slowing in-migration and reduced demand due to affordability constraints. In both counties, where median incomes are lower compared to statewide averages and poverty is above the statewide rate, fewer buyers may be entering the market, contributing to longer listings on the housing market and downward pressure on prices. These dropping prices could reflect a small market correction in these rural areas, where local residents may be less likely to have the resources to sustain demand for home purchases in the face of high prices.[10] By comparison, Belknap and Grafton Counties, where prices also rose sharply during the pandemic, continued to see relatively large growth from 2024 to 2025; this indicates that the slowdown seen in Coos and Sullivan Counties is not consistent across all rural areas.
Inventory Improving, but Still Remains Low
High housing costs reflect a significant decline in the number of homes available on the market. Single-family and condominium housing availability is commonly measured by “months of supply,” or how long the current inventory of homes for sale would last if no new listings were added to the market.[11] A supply of about 6 months is generally considered a balanced market for single-family houses. However, recent data show that New Hampshire has consistently fallen below this benchmark in recent years.[12]
In 2025, New Hampshire averaged 1.8 months of supply for single-family houses, only a slight increase from the average of 1.2 months recorded from April-December 2021. While inventory has increased slightly, it follows steep declines between 2019 and 2020, reflecting the start of the COVID-19 pandemic.[13] Declines during this time were driven in part by historically low mortgage interest rates, which likely increased buyer market activity, along with greater flexibility to relocate during the pandemic due to the utilization of remote work opportunities.
Relatively low inventory continues to influence elevated housing costs, particularly compared to neighboring states. From April-December 2021 to all of 2025, Vermont’s housing supply increased by an average of 1.7 months of inventory (from 1.7 to 3.4 months), while Massachusetts saw a 1.0-month increase (from 1.1 to 2.1 months). By comparison, New Hampshire’s average inventory increased by only 0.6 months of supply over the same time period, reflecting a slower pace of housing recovery and continued supply constraints.[14]
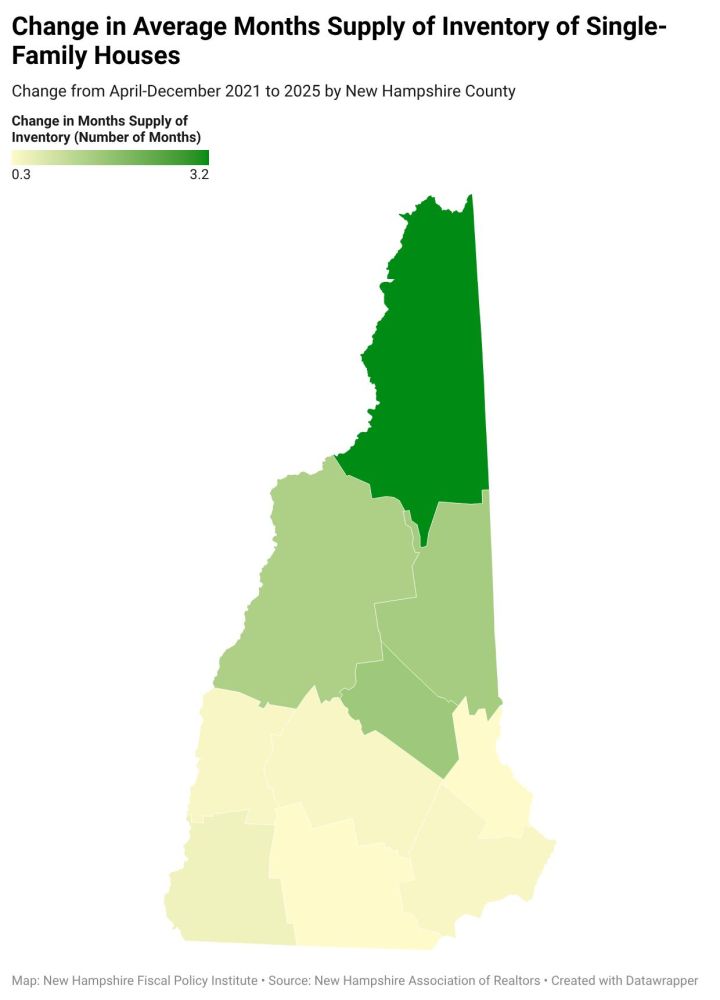
While housing inventory has increased only slightly statewide, several counties have experienced more notable gains. Between April-December 2021 and 2025, Coos County saw the largest increase in months of supply, adding an estimated 3.2 months of supply from 2.2 months in 2021 to 5.4 months in 2025; much of this growth occurred between 2023 and 2025, with the added supply likely contributing to the county’s recent annual decline in median single-family house sale prices. Other rural counties have also seen increases in inventory over this period, including Belknap County (up 1.6 months, from 1.5 to 3.1), Carroll County (up 1.5 months, from 1.7 to 3.2), and Grafton County (up 1.4 months, from 1.6 to 3.0).[15]
New Hampshire Housing, the state’s housing finance authority, estimated that the state will need to add nearly 90,000 housing units to the market by 2040 to meet demand based on population growth.[16] As of the most recent data from the New Hampshire Department of Business and Economic Affairs, the state has reached approximately 29% of that goal as of 2024, with nearly 63,000 additional units needed to meet demand and help stabilize the market. In 2024, New Hampshire’s municipalities issued building permits for the construction of 5,822 housing units, which was the highest annual total recorded since 2006, with multi-unit buildings representing about two-thirds of permits. However, new housing development remains concentrated in a relatively small number of communities. In the recent 2024 data, 23 communities, primarily located in the southeastern region of the state and home to about 43.5% of the state’s population, accounted for nearly two-thirds (63%) of all permitted units.[17]
While permitting data can provide some insight into planned housing developments, these data only reflect projects approved for construction, rather than completed housing units added to the market. Factors such as high costs, workforce shortages, regulatory delays, and infrastructure constraints can slow the timeline from permit approval to project completion, ultimately delaying when units become available for sale or rent on the market.
Renters Are More Likely to be Housing Cost Burdened
As of the most recent data, the median monthly rental price for a two-bedroom unit in New Hampshire, including utility costs, reached $1,833 in 2024, a 58.4% increase from $1,157 in 2015, unadjusted for inflation.[18] Similar to trends in single-family house sale prices, rental costs have risen most sharply in rural regions of the state. From 2019 to 2024, prices increased the fastest in Grafton County (67%), likely driven by economic activity and higher rents around Lebanon and Plymouth. Belknap, Coos, and Sullivan Counties also saw substantial increases of 44%, 42%, and 40%, respectively. All other counties in the state saw increases at or below the statewide growth rate of 36% over the same time period.[19]
High rental costs have been generally fueled by low vacancy rates across the state. According to New Hampshire Housing, a 5% vacancy rate is considered a balanced rental market, where the supply of available units meets needed demand. However, the state’s vacancy rate for two-bedroom units has consistently fallen below this benchmark since at least 2009, reaching a recent record low of 0.3% in 2022.[20] This ongoing shortage of available units has placed upward pressure on rental costs statewide.
While rental costs have not increased as rapidly as single-family house sale prices, renters are more likely to be housing cost burdened.[21]According to the U.S. Department of Housing and Urban Development, households paying more than 30% of their income towards both rent and utilities are considered to be housing cost burdened.[22] In 2024, approximately 49.4% of the state’s renters met this definition, compared to 28.0% of homeowners with a mortgage and 19.5% of those without a mortgage.[23]
Cost burden is not evenly distributed, with certain populations more likely to spend a disproportionate share of their income on housing. Based on aggregated data from 2020-2024, about 76.3% of renter households with incomes of $35,000 or less were cost burdened; approximately 55.2% were extremely cost burdened, meaning they paid more than half of their incomes towards rent and utilities combined.[24] Higher rates of cost burden were also observed among Granite State households headed by an older adult age 65 or older (56% were cost burdened), as well as among households headed by a person with a disability (56.4%).[25]
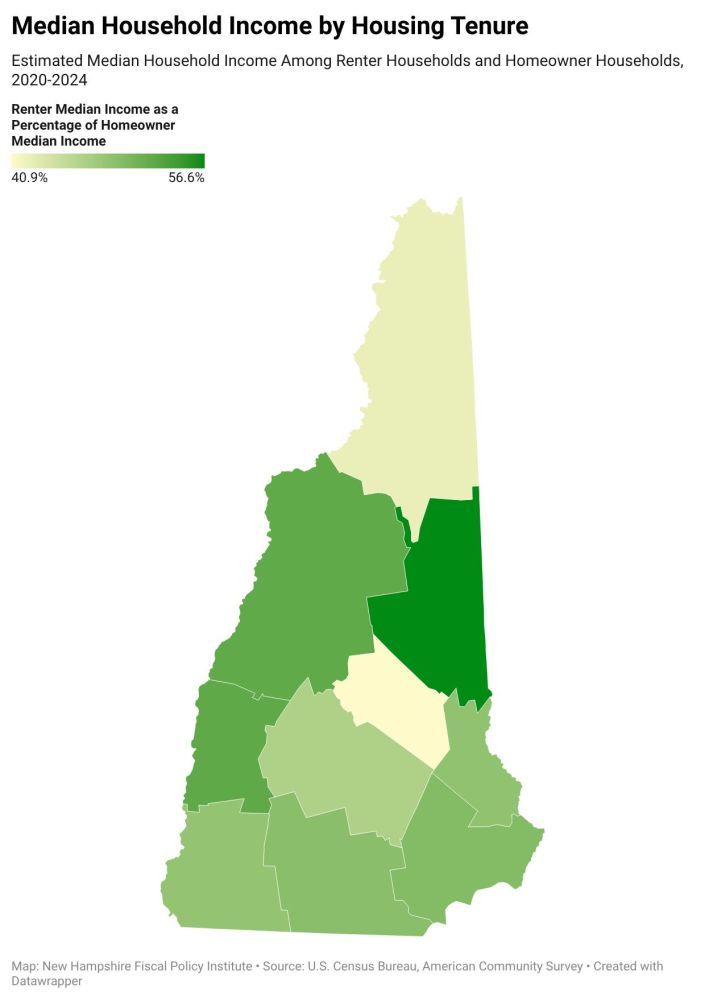
In addition to greater experiences of cost burden, renter households typically have incomes far lower than homeowner households. In 2024, the median income among renters was $58,715, nearly half of the $119,152 median income for homeowners.[26] Income gaps also varied by county. During the 2020-2024 period, renter households in Carroll County had a median income equal to about 56.6% of that of homeowners, while in Sullivan and Grafton Counties, renters earned around 52.0% of homeowner incomes.[27] These trends highlight how both rising costs and uneven income distribution contribute to housing affordability challenges across New Hampshire, which can limit renter households from entering into the homeownership market.
Housing Costs Continue to Outpace Income
Housing costs have continued to outpace incomes, constraining household budgets for families across the Granite State. From 2019 to 2024, the most recent years of data available, the statewide median household income increased by about 28%; comparatively, the median price of single-family house rose by 71.7% during this time period. Renters have faced the same constraints, with the statewide median income among renter households rising by 30.2%, compared to a 36.1% jump recorded in the median price for a two-bedroom rental unit.[28]
As prices have increased, homeownership has moved further out of reach for many people looking to remain in and move to New Hampshire. Based on the statewide median single-family house sale price ($535,000), the average statewide property tax rate ($15.83 per 1,000), the average 30-year fixed mortgage rate (6.6%), and a 5% down payment ($26,750), a homebuyer in 2025 would have faced a mortgage payment exceeding $3,950 per month, not including any purchasing fees, homeowners’ insurance, and other costs that come with owning a home.[29] In order to avoid being cost burdened, or pay over 30% of income on mortgage payments, a household would have needed to earn over $158,000, or $76 per hour in a 40-hour workweek, in 2025. As of the most recent data from 2024, only about a third of households in New Hampshire had incomes over $150,000.[30]
High housing costs have also made it increasingly difficult for many of New Hampshire’s essential workers to afford rental housing. According to a New Hampshire Housing report examining fifteen key employment sectors, only two sectors (registered nurses and software developers) had median hourly wages high enough to afford a two-bedroom rental unit without being cost-burdened. For example, early care and education workers had a median salary of about $33,904 in 2024. To avoid being cost burdened, or pay more than 30% of their income on rent and utilities, such workers could afford a maximum monthly rent of about $848, well below the actual median rental costs for that year. Home health and personal care aides and nursing assistants, both vital for supporting the state’s aging population, could afford maximum monthly rents of about $898 and $1,147, respectively.[31]
Looking Ahead: New Housing-Related Laws and Bills Currently Being Considered
In 2025, State lawmakers passed several housing-related laws aimed at increasing production and expanding supply across New Hampshire. One initiative, commonly referred to as “homes near jobs,” allows for multi-family housing to be constructed on land zoned for commercial use, utilizing existing infrastructure to support new development. Policymakers also passed legislation permitting accessory dwelling units (ADUs) by right on most single-family house lots, replacing previous law that allowed municipalities to impose more restrictive requirements for construction. In addition, lawmakers also updated parking requirements for apartment developments, prohibiting municipalities from requiring more than one parking space per unit, which could help improve housing availability. As part of the new State Budget for the State Fiscal Years 2026-2027 biennium, lawmakers passed a provision streamlining the permitting process by requiring most decisions to be made within 60-days.[32]
While regulatory changes could help support housing development, reductions in financial investments could limit some future progress. During the State Fiscal Years 2024-2025 State Budget biennium, the State made several appropriations to help support housing construction. Larger investments included $10 million for the Invest New Hampshire program, originally funded with $100 million in pandemic-related federal dollars, to support developers building multifamily housing, as well as $25 million for the Affordable Housing Fund to provide loans for projects supporting those with low and moderate incomes. Because these appropriations were one-time investments and were not repeated in the 2026-2027 State Budget, this reduction could constrain future projects and developments.[33]
As municipalities across New Hampshire work to implement the newly passed laws, more than a dozen housing-related bills are currently being considered by lawmakers this 2026 legislative session. One key bill would provide more municipal flexibility to the state’s community revitalization tax incentive program, which provides tax incentives for property owners looking to rehabilitate underutilized buildings.[34] A separate bill would allow municipalities to establish special assessment districts, which could provide additional funding streams to help pay for infrastructure upgrades to support new housing development.[35] A third proposal would reduce regulatory requirements for certain small condominium developments, which could help increase new construction and expand homeownership opportunities.[36]
The state’s housing shortage has been ongoing across nearly two decades of underbuilding following the Great Recession. No single housing-related policy or initiative will resolve the state’s housing shortage quickly. Several multi-pronged approaches will be needed to address New Hampshire’s ongoing affordable housing crisis, including immediate assistance for Granite Staters struggling to afford housing, regulatory changes to help provide more opportunities for new housing developments, and financial investments to help support production and affordability.
[1] See the New Hampshire Association of Realtors, Market Data, Year-Over-Year Data, Statewide.
[2] See the New Hampshire Association of Realtors, Market Data, Statewide Monthly Indicators, February 2026, page 5.
[3] See the New Hampshire Association of Realtors, Market and Policy Update.
[4] See the Vermont Association of Realtors, Real Estate Market Reports; the Maine Association of Realtors, Home Sales Statistics and Press Releases; and the Massachusetts Association of Realtors, Market Data.
[5] See the National Association of Realtors, Single-Family Existing Home Sales and Prices, Single-Family Only. Note that data prior to 2023 was not publicly available. The northeast region includes Connecticut, Maine, Massachusetts, New Hampshire, New Jersey, New York, Pennsylvania, Rhode Island, and Vermont.
[6] See the New Hampshire Association of Realtors, Market Data, Year-Over-Year Data, Statewide.
[7] See the New Hampshire Association of Realtors, Market Data, Year-Over-Year Data, County-level Reports.
[8] For more information on New Hampshire’s population and demographics, see NHFPI’s August 2024 Issue Brief, New Hampshire’s Growing Population and Changing Demographics Before and Since the COVID-19 Pandemic.
[9] See the New Hampshire Association of Realtors, Market Data, Year-Over-Year Data, County-level Reports.
[10] For more information on county-level median income differences, see NHFPI’s March 2026 blog, Differences in Household Income Between New Hampshire Counties.
[11] See the Federal Reserve Bank of St. Louis, Monthly Supply of New Houses in the United States.
[12] The New Hampshire Association of Realtors identifies a balanced market as 5-7 months of inventory. Earlier data from Texas A&M’s Real Estate Centeridentifies a balanced market as 6.5 months supply of inventory.
[13] See the New Hampshire Association of Realtors, Market Data, Statewide Monthly Indicators. Note that the months supply of inventory represents the annual average. Data may be subject to change, as numbers are adjusted and updated overtime. Data before April 2021 was unavailable publicly at the time of data pull from the New Hampshire Realtors’ webpage.
[14] See the Vermont Association of Realtors, Real Estate Market Reports; the Massachusetts Association of Realtors, Market Data; and the New Hampshire Association of Realtors, Market Data, Statewide Monthly Indicators. Note that Maine’s inventory data is unavailable publicly via their webpage.
[15] See the New Hampshire Association of Realtors, Market Data, County-level Monthly Indicators. Note that the months supply of inventory represents the annual average. Data may be subject to change, as numbers are adjusted and updated overtime. Data before April 2021 was unavailable publicly at the time of data pull from the New Hampshire Realtors’ webpage.
[16] See New Hampshire Housing, 2023 New Hampshire Statewide Housing Needs Assessment, page 4.
[17] See the New Hampshire Department of Business and Economic Affairs, Office of Planning and Development, Current Estimates and Trends in New Hampshire’s Housing Supply, January 2026 Report.
[18] For more information on rental price trends in New Hampshire, see NHFPI’s August 2024 blog, New Hampshire Rental Costs Continued to Rise in Early 2024, Increasing Impacts on Tenant Household Budgets.
[19] See New Hampshire Housing, 2024 Residential Rental Cost Survey Report, pages 5-6.
[20] See New Hampshire Housing, 2023 Residential Rental Cost Survey Report, page 10. Note that vacancy rate data was unavailable in the 2024 Rental Cost Report.
[21] For more information on renter cost burden, see NHFPI’s September 2024 blog, New Hampshire Renters Were Cost-Burdened by Housing at Higher Rates than Homeowners in 2023.
[22] See the U.S. Department of Housing and Urban Development, Office of Policy Development and Research, Comprehensive Housing Affordability Strategy Data, Definitions. See also the U.S. Department of Housing and Urban Development, Office of Community Planning and Development, Affordable Housing.
[23] See the U.S. Census Bureau, American Community Survey, DP04: Selected Housing Characteristics, 1-Year Estimates, 2024.
[24] See the U.S. Census Bureau, American Community Survey, B25074: Household Income by Gross Rent as a Percentage of Household Income in the Past 12 Months, 5-Year Estimates, 2020-2024.
[25] See the U.S. Census Bureau, Microdata Access Tool. Data for older adults calculated by using the variables for gross rent as a percentage of household income and age recode. Data for people with disabilities calculated by using the variables for gross rent as a percentage of household income and disability recode.
[26] See the U.S. Census Bureau, American Community Survey, B25119: Median Household Income in the Past 12 Months by Tenure, 1-Year Estimates, 2024.
[27] See the U.S. Census Bureau, American Community Survey, B25119: Median Household Income in the Past 12 Months by Tenure, 5-Year Estimates, 2020-2024.
[28] See the U.S. Census Bureau, American Community Survey, B25119: Median Household Income in the Past 12 Months by Tenure, 1-Year Estimates; the U.S. Census Bureau, American Community Survey, S1901: Income in the Past 12 Months, 1-Year Estimates; New Hampshire Housing, 2024 Residential Rental Cost Survey Report, page 5; and the New Hampshire Association of Realtors, Market Data, Year-Over-Year Data, Statewide.
[29] Estimated monthly mortgage costs calculated using Federal Reserve Bank of St. Louis, 30-Year Fixed Rate Mortgage Average in United States; the New Hampshire Association of Realtors, Market Data, Year-Over-Year Data, Statewide; the New Hampshire Department of Revenue Administration, Annual Reports; and Federal Reserve Bank of Dallas, Payment Calculator. Note that monthly property tax estimates were calculated using sale prices which are typically higher than house value assessments for tax purposes. Also, estimated monthly mortgage payment assumes 5 percent downpayments and does not include homeowner’s insurance or private mortgage insurance.
[30] See the U.S. Census Bureau, American Community Survey, S1901: Income in the Past 12 Months, 1-Year Estimates, 2024.
[31] See New Hampshire Housing, Who Can Afford to Live in New Hampshire?, pages 7-8.
[32] See House Bill 631, House Bill 577, and Senate Bill 284. See also the State Operating Budget for State Fiscal Years 2026-2027, House Bill 2.
[33] For more information on housing-related investments in the State Budget, see NHFPI’s July 2025 Report, The State Budget for Fiscal Years 2026 and 2027.
[34] See House Bill 1103. For more information on RSA 79-E or the community revitalization tax relief incentive program, see New Hampshire Housing, A Municipal Guide to RSA 79-E, 2024.
[35] See House Bill 1588.
[36] See Senate Bill 415.
The New Hampshire Fiscal Policy Institute is sharing these articles with the partners in The Granite State News Collaborative. NHFPI is an independent nonprofit organization that explores, develops and promotes public policies that foster economic opportunity and prosperity for all New Hampshire residents. For more information visit nhfpi.org. These articles are being shared by partners in The Granite State News Collaborative. For more information visit collaborativenh.org.